
As we’re getting into Spring and COVID-19 vaccination is rolling out, it’s time to revisit the all-cause mortality data for the US. As a quick refresher, all-cause mortality data is important because (after a few hours) there’s no ambiguity to whether a person is dead or alive and so mortality numbers are comparable across time, medical systems, states, countries, etc. If a person with COPD and COVID-19 died, we can have legitimate arguments about whether they died from COPD or COVID-19; we will all agree that they’re dead. Thus we can look at trends in all-cause mortality to get a sense of what might be going on. It won’t tell us what is going on, but it’s a very important sanity check.
On caveat to this is necessary. While it is the case that all-cause mortality is reliable, it’s only reliable over time. At least in the United States, it takes up to two months for all deaths to be reported to the CDC. The CDC, therefore, estimates deaths for the most recent two months on the basis of how jurisdictions have historically updated their numbers over time. In the past, that has meant sometimes over-estimating deaths; in the last year or so that’s tended to under-estimate the deaths, so we have to assume that the most recent 6 bars on the graph will grow over time, though less the further in the past they are. That said, let’s look at the data:

To see the change over the last two months, let’s look at what the graph was back in February:
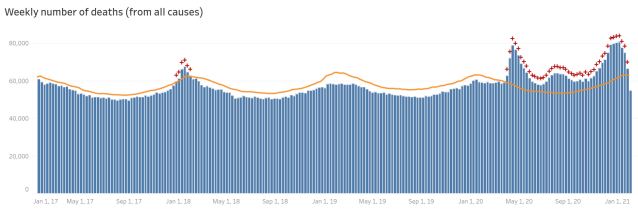
As you can see, the third wave did eventually turn out to be very slightly higher than the first wave, though it was considerably wider at that height than the first wave. On the other hand, the first wave was mostly just New York City, while the third wave was most of the country.
Unfortunately, the data being so unreliable for the most recent two months makes it very difficult to draw much in the way of conclusions. We haven’t seen so many recent weeks in a row so far under the excess-mortality line but we can’t really know if that’s just because the jurisdictions are now sitting on data even longer than normal before reporting it. The change in presidential administration is not likely to have made the various jurisdictions substantially worse at reporting deaths, but it cannot entirely be ruled out as impossible. (I have in mind less cascading incompetence and more a change in priorities making old priorities fall by the wayside.) I think that we can reasonably assume that the jurisdictions haven’t suddenly turned radically incompetent, though, so we can at least conclude that the third wave is over.
Past that there isn’t much to say. All of the interesting data is in the window that is too subject to revision to say much about it. It’s suggestive, but at this point we need more to refrain from conclusions than to even tentatively come to conclusions. I suspect in another six months, we’ll be in a good position to start doing historical analysis on the covid-19 contemporary analysis and reactions vs. what actually happened.
Discover more from Chris Lansdown
Subscribe to get the latest posts sent to your email.

Pingback: All-Cause Mortality Data for the USA – Chris Lansdown
Pingback: USA All-Cause Mortality Data Through January 2021 – Chris Lansdown
Pingback: All Cause Mortality – Chris Lansdown
Would it be possible to link (or make) a chart of total annual mortality over the last ten or twenty years, including 2020?
LikeLike
Unfortunately, I don’t know of a source for data that extensive.
LikeLike